
GraphPad Prism 6.01

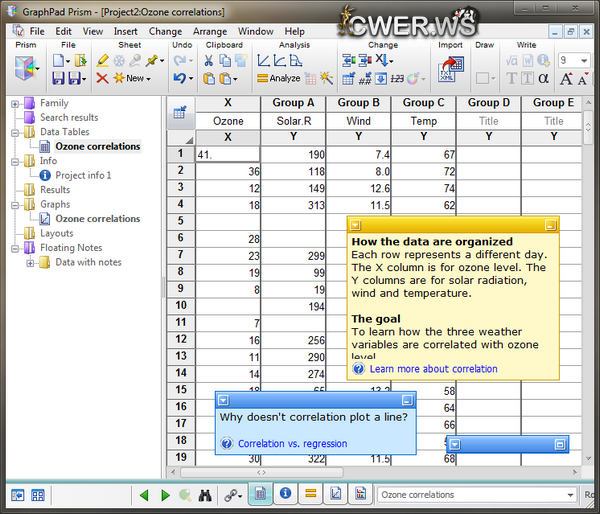
GraphPad Prism предлагает пользователям уникальный подход к анализу и представлению в графической форме научной информации. Вам нужно всего лишь сохранить всю информацию о своем проекте (все связанные данные, графики, примечание и т.д.) в одном файле. Затем, когда вы измените какие-нибудь данные, программа сама модифицирует остальную часть проекта.
Statistical comparisons
- Paired or unpaired t tests. Reports P values and confidence intervals.
- Nonparametric Mann-Whitney test, including confidence interval of difference of medians.
- Kolmogorov-Smirnov test.
- Wilcoxon test with confidence interval of median.
- Perform many t tests at once, using False Discover Rate to choose which comparisons are discoveries to study further.
- Ordinary or repeated measures one-way ANOVA followed by the Tukey, Newman-Keuls, Dunnett, Bonferroni or Holm-Sidak multiple comparison tests, the post-test for trend, or Fisher’s Least Significant tests.
- Many multiple comparisons test are accompanied by confidence intervals and multiplicity adjusted P values.
- Greenhouse-Geisser correction so repeated measures one-way ANOVA does not have to assume sphericity. When this is chosen, multiple comparison tests also do not assume sphericity.
- Kruskal-Wallis or Friedman nonparametric one-way ANOVA with Dunn's post test.
- Fisher's exact test or the chi-square test. Calculate the relative risk and odds ratio with confidence intervals.
- Two-way ANOVA, even with missing values with some post tests.
- Two-way ANOVA, with repeated measures in one or both factors. Tukey, Newman-Keuls, Dunnett, Bonferron, Holm-Sidak, or Fishers LSD multiple comparisons testing main and simple effects.
- Kaplan-Meier survival analysis. Compare curves with the log-rank test (including test for trend).
Column statistics
- Calculate min, max, quartiles, mean, SD, SEM, CI, CV,
- Mean or geometric mean with confidence intervals.
- Frequency distributions (bin to histogram), including cumulative histograms.
- Normality testing by three methods.
- One sample t test or Wilcoxon test to compare the column mean (or median) with a theoretical value.
- Skewness and Kurtosis.
- Identify outliers using Grubbs or ROUT method.
Linear regression and correlation
- Calculate slope and intercept with confidence intervals.
- Force the regression line through a specified point.
- Fit to replicate Y values or mean Y.
- Test for departure from linearity with a runs test.
- Calculate and graph residuals.
- Compare slopes and intercepts of two or more regression lines.
- Interpolate new points along the standard curve.
- Pearson or Spearman (nonparametric) correlation.
Nonlinear regression
- Fit one of our 105 built-in equations, or enter your own.
- Enter differential or implicit equations.
- Enter different equations for different data sets.
- Global nonlinear regression – share parameters between data sets.
- Robust nonlinear regression.
- Automatic outlier identification or elimination.
- Compare models using extra sum-of-squares F test or AICc.
- Compare parameters between data sets.
- Apply constraints.
- Differentially weight points by several methods.
- Accept automatic initial estimated values or enter your own.
- Automatically graph curve over specified range of X values.
- Quantify precision of fits with SE or CI of parameters.
- Quantify symmetry of inprecision with Hougaard’s skewness.
- Plot confidence or prediction bands.
- Test normality of residuals.
- Runs or replicates test of adequacy of model.
- Report the covariance matrix or set of dependencies.
- Easily interpolate points from the best fit curve.
Clinical (diagnostic) lab statistics
- Bland-Altman plots.
- Receiver operator characteristic (ROC) curves.
- Deming regression (type ll linear regression).
ОС: Windows 2000, XP, Vista или Windows 7, 32- и 64-бит
Что нового в версии 6:
New Analyses – ANOVA, multiple comparisons and more
- Two-way ANOVA with repeated measures in both factors.
- Multiplicity adjusted (“exact”) P values for multiple comparison tests. Read more about this #1 request in our blog.
- New post tests - Fisher’s unprotected Least Significant Difference (LSD) and Holm-Sidak.
- Run a set of t tests (one per row) at once, correcting for multiple comparisons with Bonferroni or by contolling the False Discovery Rate (FDR).
- Follow two-way ANOVA with tests for simple or main effects. Don't worry if you don't know what that means - Prism 6 presents those choices graphically so the meaning is obvious.
- Greenhouse-Geisser correction in repeated measures one-way ANOVA to avoid the need to assume sphericity.
- Grubbs’ outlier detection. Our most popular QuickCalc web calculator is now part of Prism.
- Kolmogorov-Smirnov test to compare two groups (an alternative to the Mann-Whitney test).
- Ratio t test
Improved curve fitting
- Fit to implicit and differential models.
- Write more complex models.
- Quicker interpolations. Prism 6 adds a new analysis that streamlines the process of interpolating values from standard curves.
- Weight your fit by 1/Y^k
- Monte-Carlo simulations without writing scripts.
Pie charts and more
- Prism 6 adds a new kind of data table for parts of whole data. Plot pie charts, donut plots and more.
- Compare the observed distribution of values with theoretically expected values with the chi-squared or binomial test.
- Compute each value as a fraction or percentage of the column total.
Work with larger data sets
- Enter data in up to 256 data set columns.
- Enter up to 256 subcolumns per data set (up from 52 in Prism 5). This lets you compute repeated measures two-way ANOVA with more subjects.
Work more efficiently
- Faster. Faster saving, faster closing, faster nonparametric calculations, faster graphing, faster, crisper screen redraws.
- Format several data sets at once. Want to plot alternating columns as dotted lines? Now you can do it in one step.
- View and edit all of your column titles at once. Great for large files!
- Choose the size, shape and color of your data points right from the data table. You can even select any contiguous block of data and make choices for that specific subset of your data table.
- WAND. If you love MAGIC, you will love the new WAND. While MAGIC reformats graphs, the WAND analyzes and graphs a new data table to match what you have done to another.
- Paste link values from results tables into a data table so everything updates automatically. This also works if you want to link data from one data table to another.
Plays well with others
- Export graphs in more formats.
- Better TIFF compression means smaller files and faster exporting.
- Import more types of graphic files into your Prism layouts.
- Control whether to use periods or commas as a decimal separator from within Prism.
- Choose how to handle excluded values when you export/paste from Prism data tables.
Скачать программу GraphPad Prism 6.01 (18,11 МБ):
Bukkollaider 01/12/12 Просмотров: 3738
0